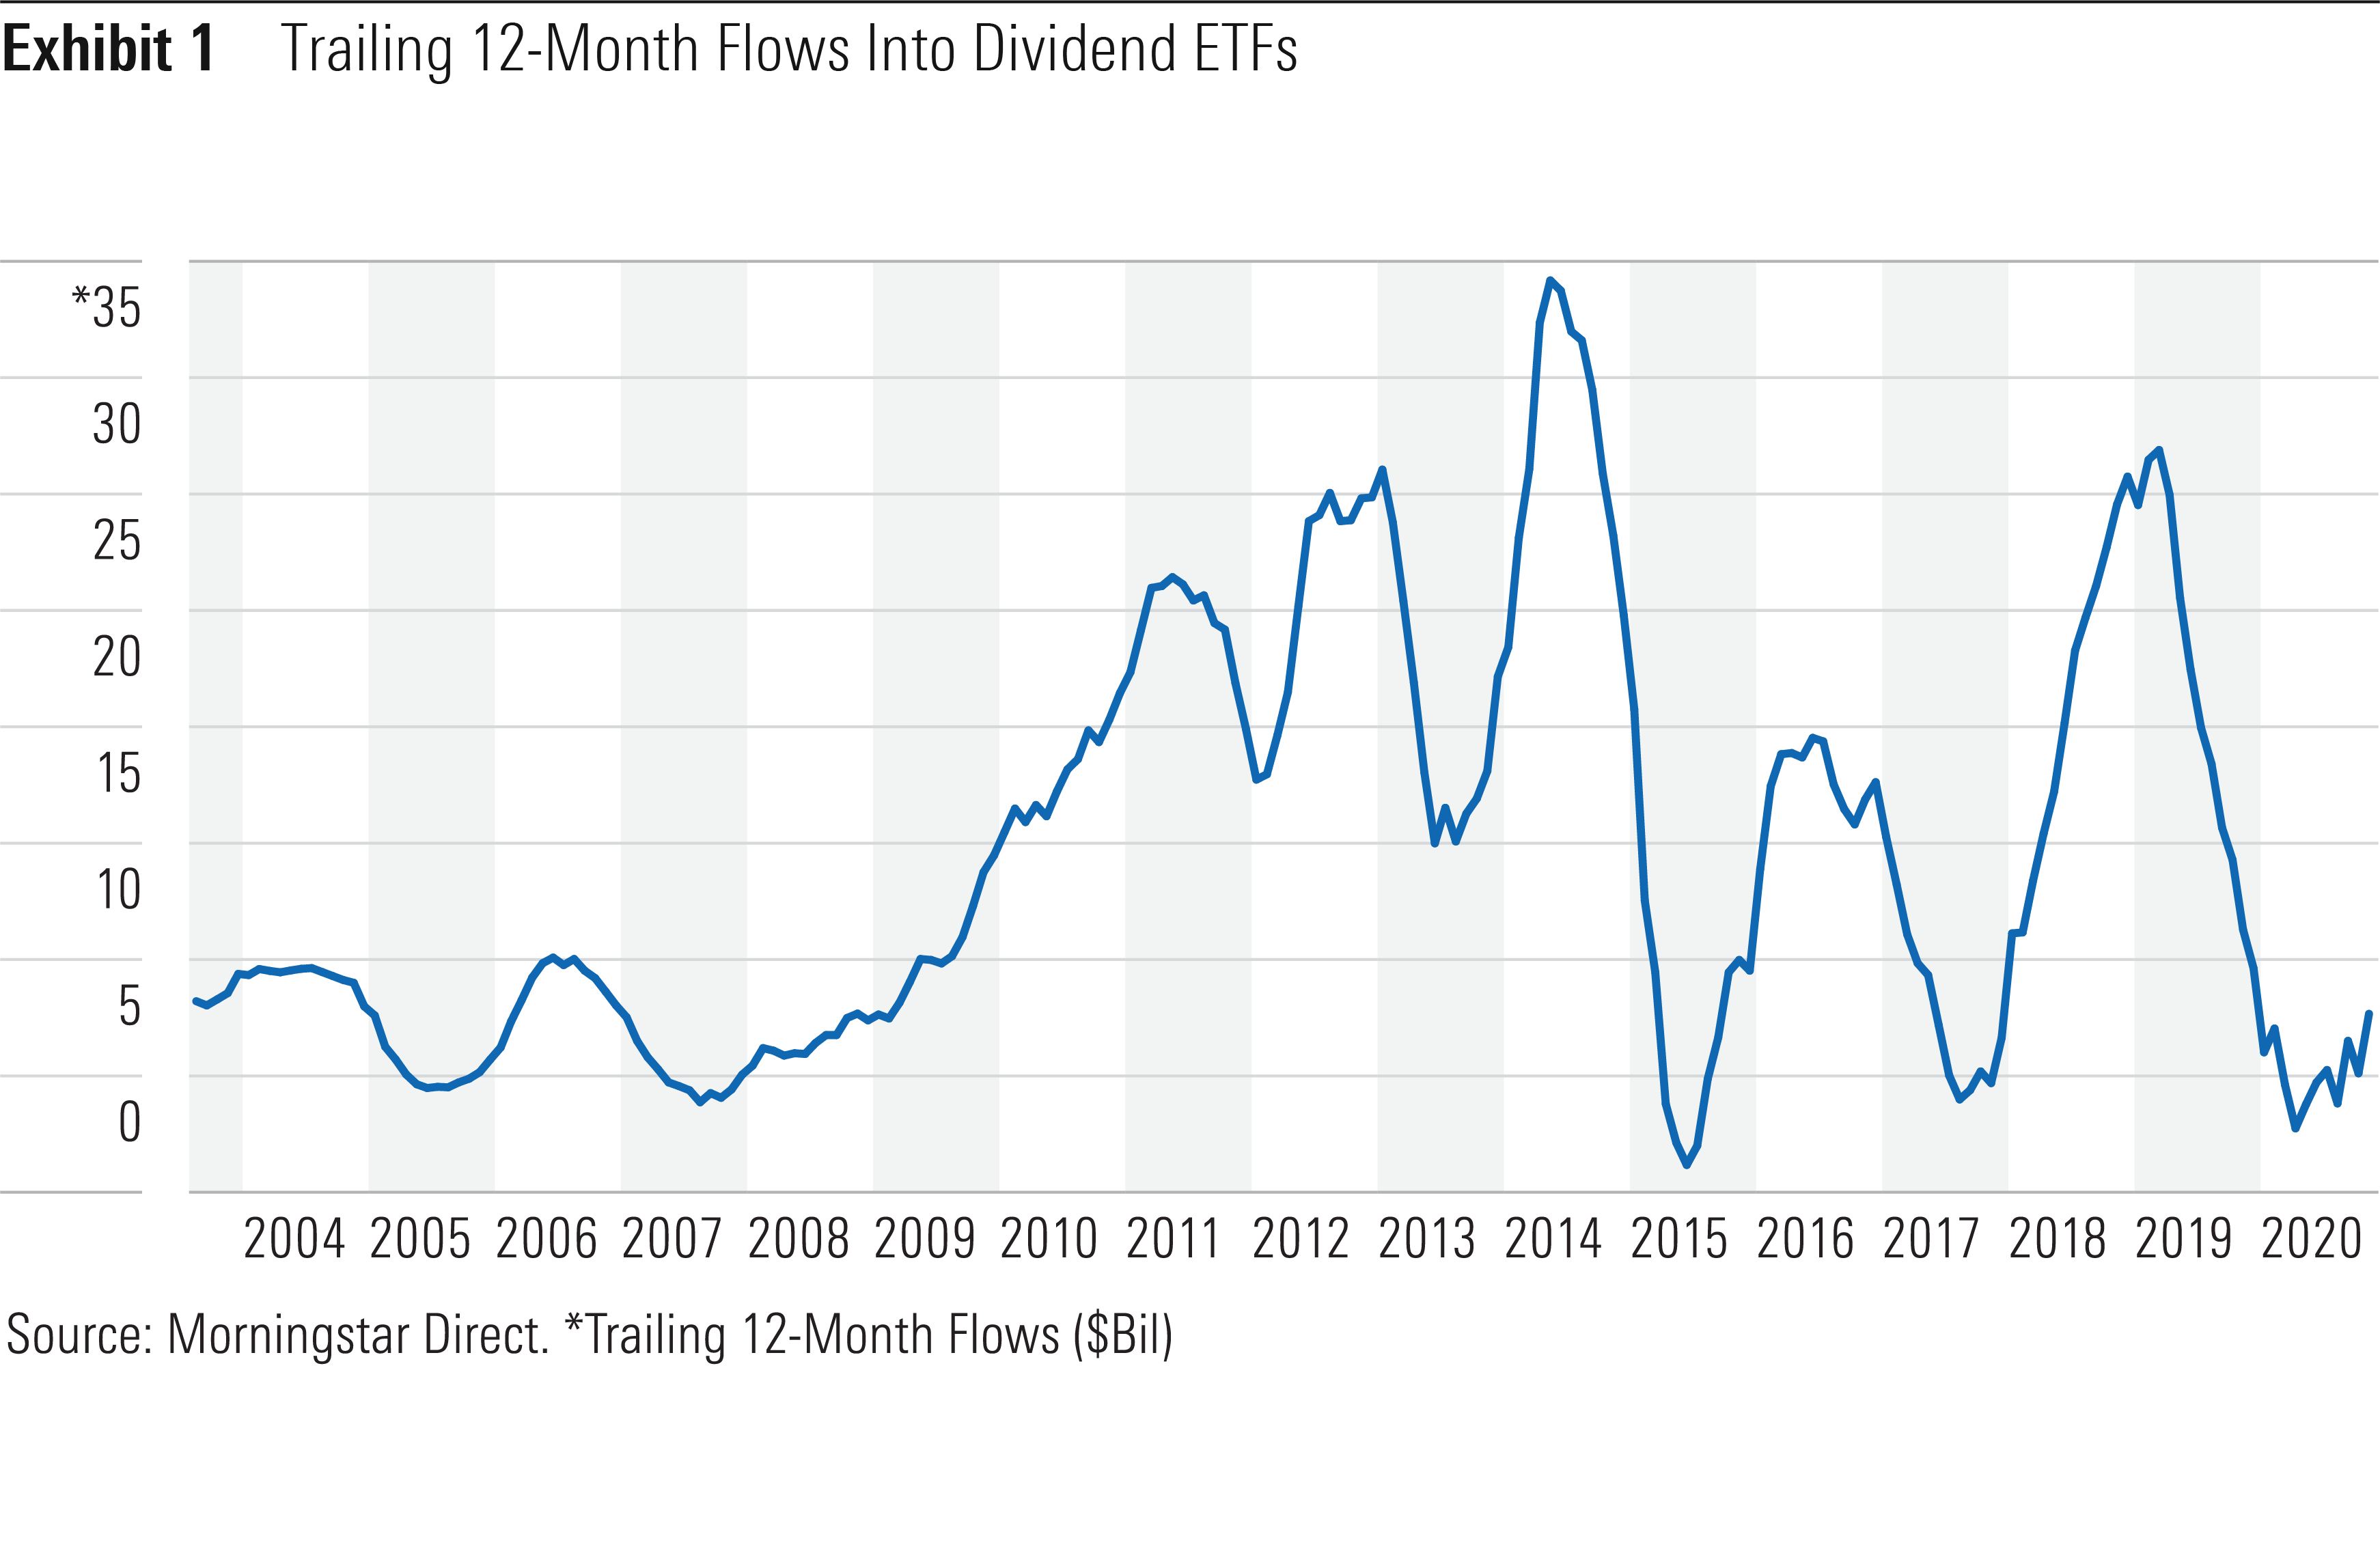
Exchange-traded funds belonging to Morningstar's "dividend" strategic-beta group form one of the largest contingents within this universe as measured by assets under management. As of the end of November 2020, these funds collectively held US$223 billion of investors' assets.
This group has been growing at a blistering pace in recent years. During the past decade, dividend ETFs have attracted US$140 billion in new money.
This should come as little surprise; interest rates have been trending lower, and demand for reliable sources of investment income has surged as the first waves of baby boomers have entered retirement.
Asset managers have taken notice, and product proliferation has been the result. Of the 134 dividend ETFs that exist today, nearly three fourths are less than a decade old. Now faced with an expansive menu of dividend ETFs, it is important investors understand that these funds are not all created equal. Each has unique characteristics, which stem from important--albeit often nuanced--differences in the methodologies of their underlying indexes.
Understanding three key characteristics of these funds can help investors make more-informed choices. These include dividend yield, dividend growth, and dividend durability.

Dividend Yield
A fund's current dividend yield is often the first metric investors look at when shopping for equity-income opportunities. The 12-month-yield metric aggregates an ETF's income distributions during the trailing 12 months and then divides that figure by the fund's net asset value. While this metric is interesting, it is not very useful in isolation. It needs context.
Framing a fund's 12-month yield in the background of its historical values and relative to the current and historical values for comparable strategies helps put ETFs' current yields in perspective. Exhibit 2 plots the current, average, maximum, minimum, and 75th and 25th percentiles of the monthly 12-month yields for the 11 dividend ETFs that invest in U.S. large caps and were launched prior to 2007.
It is apparent, based on a passing glance at this exhibit, that some of these funds' yields can be very volatile. And despite their similar labeling, this exhibit is a testament to just how different each fund's approach is to building a portfolio of dividend-paying stocks. For example, at the end of February 2008, the highest-yielding fund of the lot, WisdomTree U.S. High Dividend ETF (DHS), had a 12-month yield of 10.32%. The lowest-yielding fund was Vanguard Dividend Appreciation ETF (VIG), with a 12-month yield of 3.09%. That’s a spread of 7.23 percentage points. The market downdraft testified to the importance of understanding the particulars of the construction of these funds' underlying benchmarks. DHS loaded up on stocks whose payments proved unsustainable, including many financial-services firms. VIG rolls up stocks that have raised their dividends in 10 consecutive years, which is a sign of durability.
Those ETFs that focus on higher-yielding stocks and stocks with shorter track records of paying dividends tend to be riskier. A high dividend yield can indicate the market has soured on a firm's prospects and may be skeptical of its ability to continue to maintain its dividend at its current level. Keying on dividend yield will lend a value orientation to a portfolio and may put investors at risk of catching a falling knife (or two).


.png)


